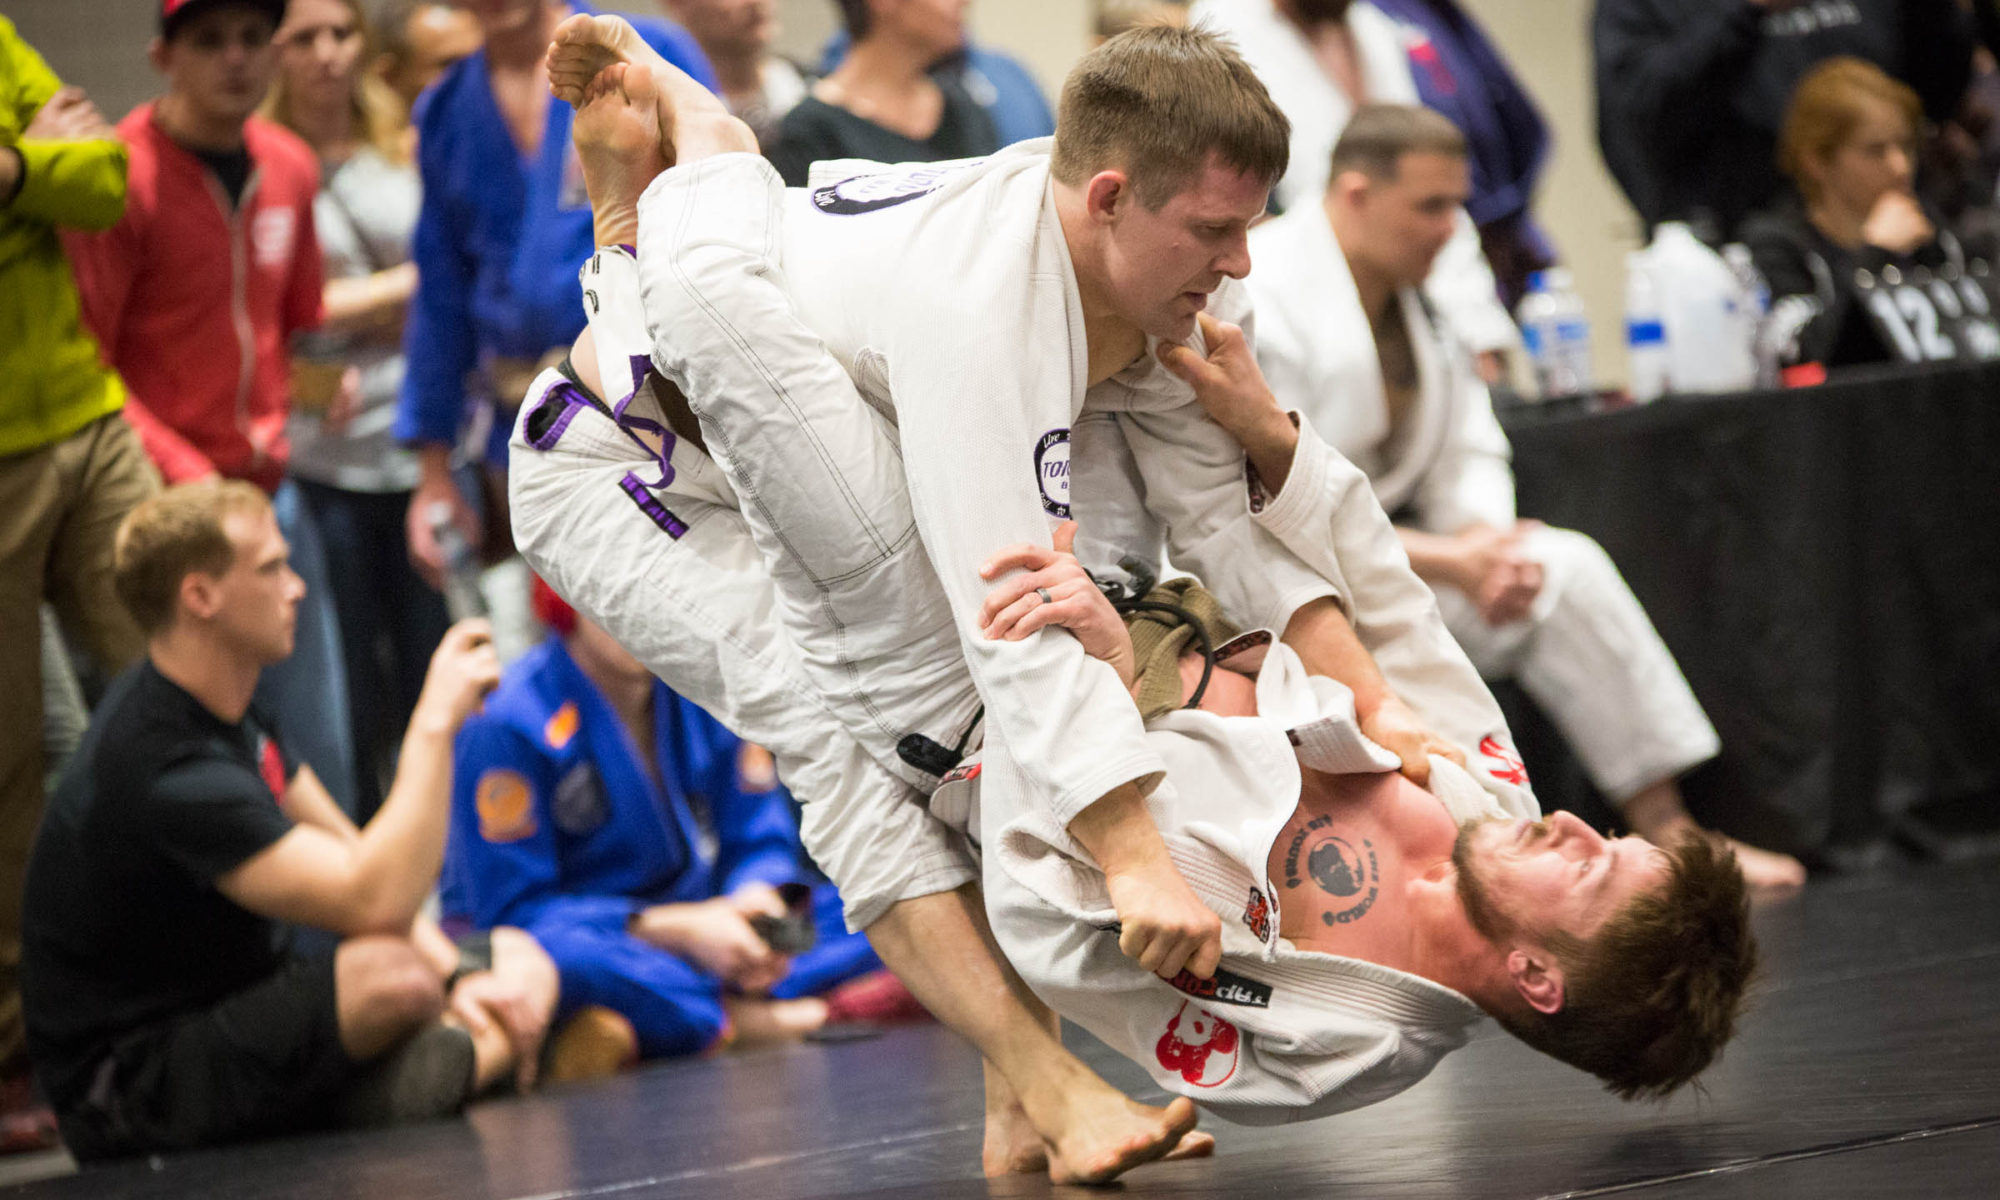
… or a graphic, actually. I’ve been taking a data visualization class, and I thought I’d try to represent the results from US Grappling’s latest tournament in image form. It’s the from the State Line Grappling Championships in Bristol, TN.
If you click here to get the full-size version, it should be pretty intuitive, but I’ll explain anyhow. Each bubble represents a match: the bigger the bubble, the longer the match went. Each bubble is color-coded by how the match finished.
I’m going to be trying to produce more of these after each tournament, so if you have comments — including suggestions for how to represent the data better — please offer ’em up. These are fun projects that allow me to combine BJJ with my inherent data nerdhood.

